Log In
Discover
Assets
Jobs
Behance
Pro
Hire Freelancers
Download on the App Store
Get it on Google Play
English
Čeština
Dansk
Deutsch
Español
Français
Italiano
Nederlands
Norsk
Polski
Português
Pусский
Suomi
Svenska
Türkçe
日本語
한국어
中文(简体)
中文(繁體)
About
Blog
TOU
Privacy
Community
Help
Do not sell or share my personal information
Sign Up
Skip to Main Content
Skip to Footer
Behance
Behance
Navigate to behance.net
Explore
Assets
Jobs
Behance
Pro
Hire Freelancers
search
magnifying glass
Sort & filter all:
Projects
Images
People
Assets
People to Hire
Cancel
search
magnifying glass
View your notifications within Behance.
View your notifications within Behance.
Log In
Sign Up
search
magnifying glass
Adobe, Inc.
Adobe, Inc.
Navigate to adobe.com
+4
Follow All
Unfollow All
Follow
Following
Tools
After Effects
Sketch App
Tools
Add to Moodboard
Save
Share & Embed This Project
Share
Appreciate
Appreciate
Follow All
Following All
Unfollow All
Follow All
Unfollow All
+4
A Guide to Data Visualization - Comparison Part 1
Multiple Owners
•
Follow All
Following All
Unfollow All
Join Behance
Sign up
or
Sign in
to view personalized recommendations, follow creatives, and more.
Sign Up With Email
Sign Up
or
Join Behance
Sign up
or
Sign in
to view personalized recommendations, follow creatives, and more.
Sign Up With Email
Sign Up
or
A Guide to Data Visualization - Comparison Part 1
2.9k
85.2k
44
Published:
January 15th 2018
+4
Multiple Owners
Follow All
Following All
Unfollow All
Owners
Shashank Sahay
London, United Kingdom
Follow
Following
Unfollow
Suvo Roy
Vancouver, British Columbia, Canada
Follow
Following
Unfollow
Prasanth Marimuthu
Chennai, India
Follow
Following
Unfollow
Adhithya Vijai
Bangalore, India
Follow
Following
Unfollow
Dhruvi Shah
Bangalore, India
Follow
Following
Unfollow
Prerna Pradeep
Bangalore, India
Follow
Following
Unfollow
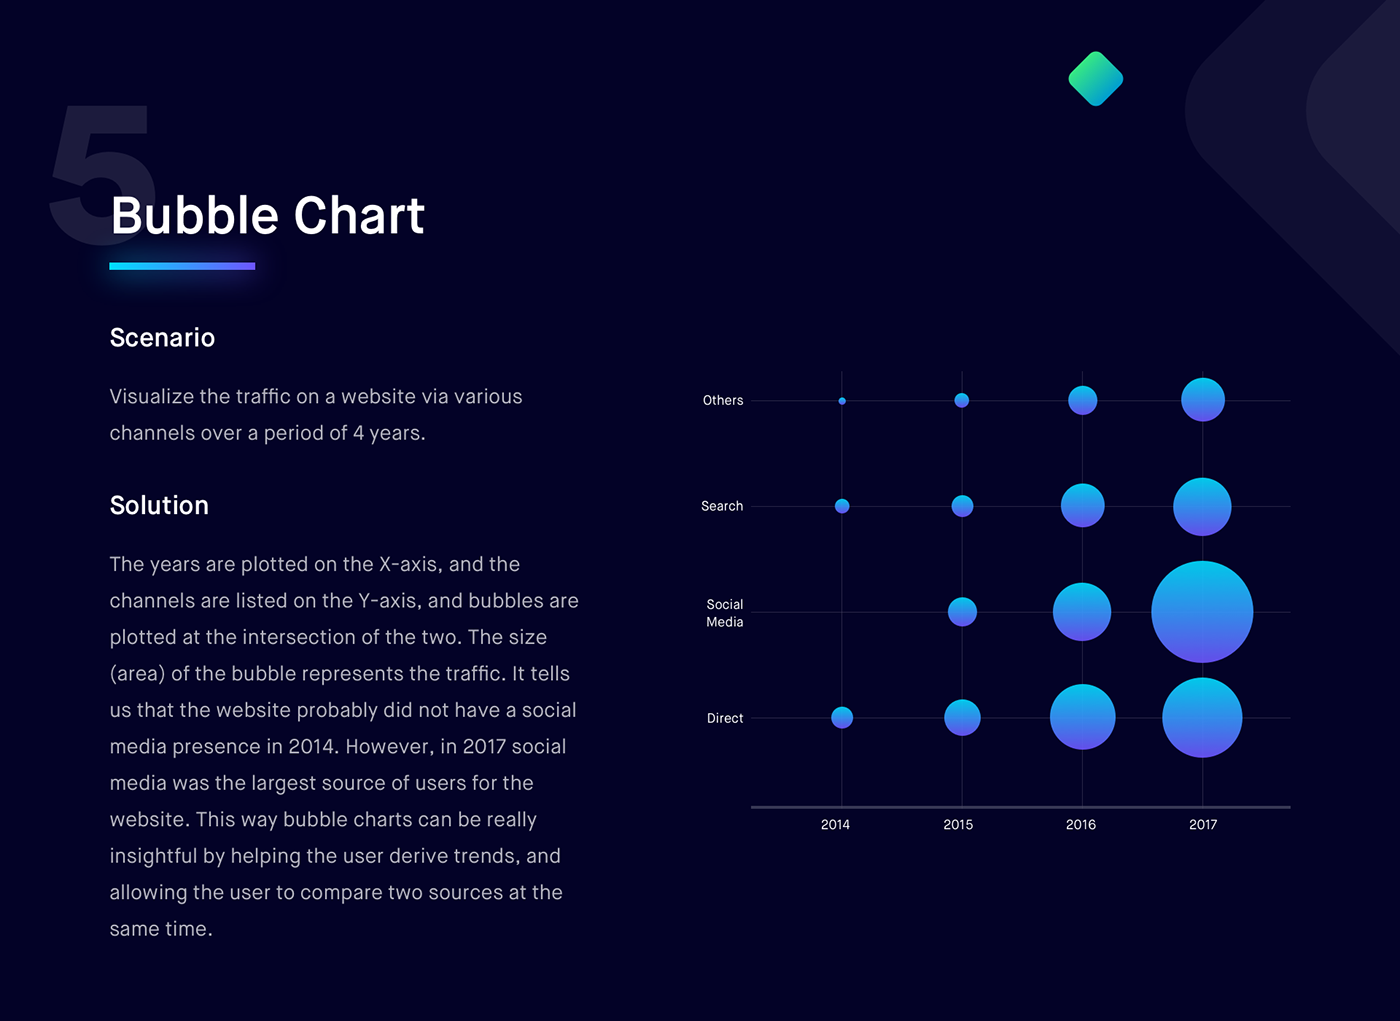
A Guide to Data Visualization - Comparison Part 1
The world has got shit ton of data, and nobody has the time to go through it one row at a time. In order to make huge sets of data consumable, we
Read More
2.9k
85.2k
44
Published:
January 15th 2018
Tools
After Effects
Sketch App
Creative Fields
UI/UX
Web Design
data visualization
graph
chart
Data
visualization
statistics
table
infographic
timeline
Copyright Info
Attribution, Non-commercial, No Derivatives
Read More
Report